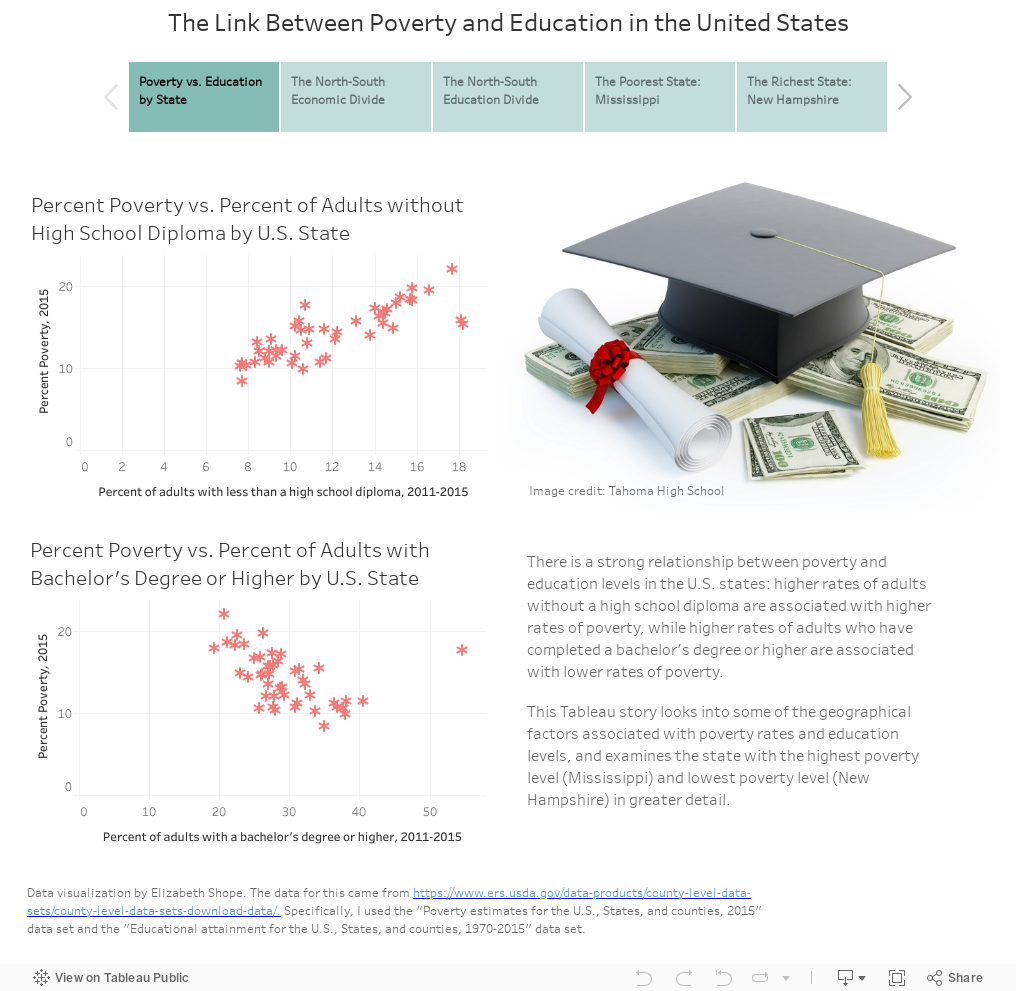
This visualization shows the link between poverty and education in the United States. In the U.S. states, there is a strong positive correlation between rates of adults without a high school diploma and poverty rates, while there is a strong negative correlation between rates of adults who have attained a bachelor's degree or higher and poverty rates. Washington, DC is an outlier, with high rates of poverty and high rates of people with a college education. This is likely due to the volume of educated people that move into Washington, DC for work.
Visualizing the poverty and education data by state, we also see that the distribution of poverty among the states and within each state is not random. Rather, on the whole, southern states are seeing much higher rates of poverty and lower educational attainment than northern states. In states like Mississippi, poverty is concentrated in a certain area of the state; for Mississippi, that area is along the Mississippi delta. While 22.1 percent of the population of Mississippi is living in poverty, some of the counties in the Mississippi delta region have poverty levels above 40 percent, including Claiborne county at 46.3 percent.
The clean data for this tableau workbook comes in two separate parts: the education data, which you can find here, and the poverty data, which you can find here. I downloaded this data from the U.S. Department of Agriculture Economic Research Service website.