Terrorism Incidents in 2016: A Global Map
This map, built with Leaflet and R, provides a visual of where terrorism is occurring globally and locally. The numbers on the circles indicate how many incidents have occurred in that region. Click on any of them to zoom in on that region, and click on any of the specific markers to see information about a specific incident.
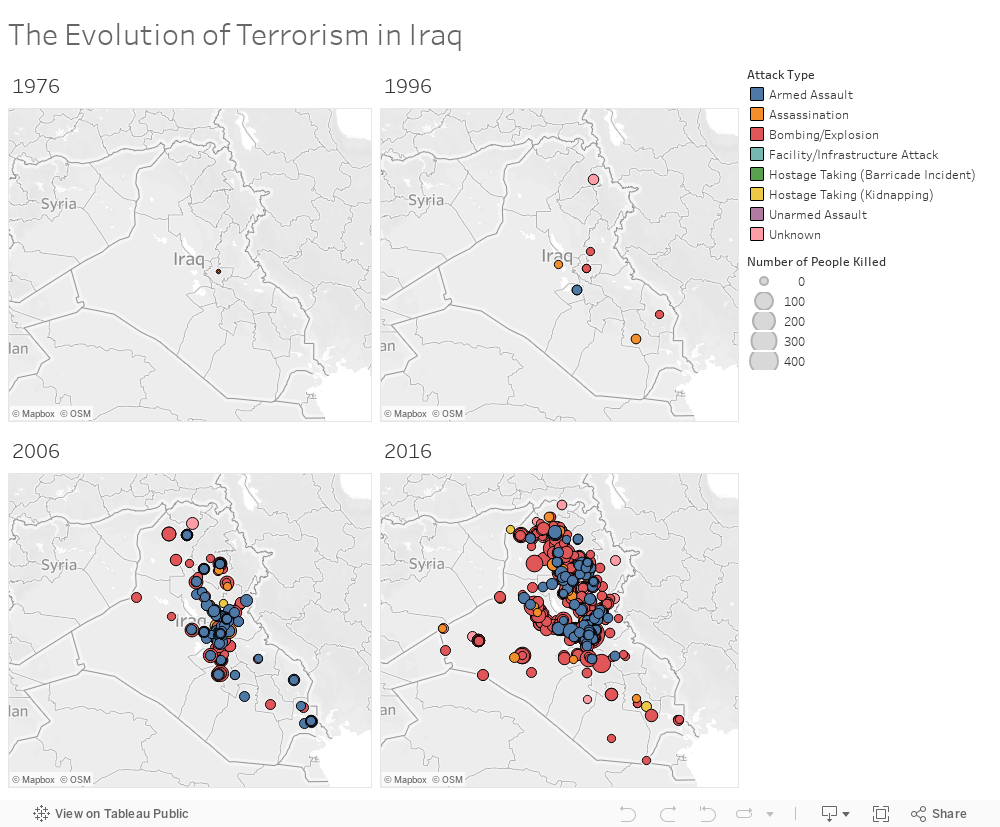
One of the most significant things we notice in this map is the huge volume of terrorism incidents in Iraq. I was interested if Iraq has been a terrorism hotspot for several decades or if this is a newer problem there, so I created a Tableau visualization of map sub-plots to analyze this.
The Evolution of Terrorism in Iraq: 4 Snapshots
Here, we look at terrorism incidents in Iraq in 1976, 1996, 2006, and 2016, which are relatively representative snapshots of these decades. There are no terrorism incidents listed in 1986 in Iraq (and not many generally in the 1980s) in the Global Terrorism Database. The number of incidents in Iraq has increased dramatically, with 3 in 1976, 0 in 1986, 832 in 2006, and 3356 in 2016.
References
You can find a link to the data subset I used for the 2016 global map here, and the code for creating the visualization here. The data subset I used for the Iraq terrorism snapshots is here. The full Global Terrorism Database is posted -- along with many visualizations by other people -- on Kaggle.